
The Navy Department Library
Appendix D: Aircraft Sortie Count
PDF Version [13.4MB]
APPENDIX D AIRCRAFT SORTIE COUNT
D-1
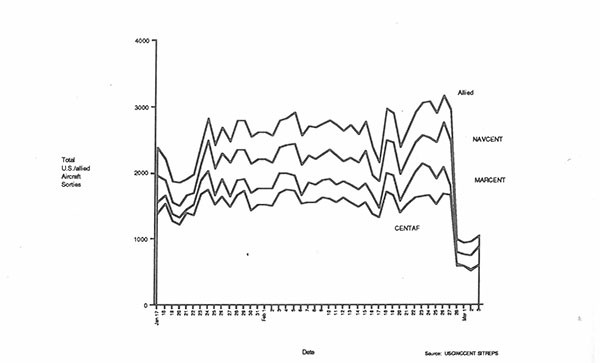
| Date | CENTAF | MARCENT | NAVCENT | Allied | Total Flown | Cum Flown |
| Jan 17 | 1381 | 169 | 415 | 423 | 2388 | * |
| 18 | 1529 | 122 | 233 | 316 | 2200 | * |
| 19 | 1275 | 108 | 178 | 302 | 1863 | * |
| 20 | 1223 | 98 | 175 | 346 | 1842 | 8323 |
| 21 | 1394 | 50 | 217 | 246 | 1907 | 10230 |
| 22 | 1362 | 149 | 189 | 282 | 1982 | 12212 |
| 23 | 1679 | 216 | 238 | 291 | 2424 | 14636 |
| 24 | 1741 | 278 | 455 | 337 | 2811 | 17447 |
| 25 | 1526 | 138 | 396 | 347 | 2407 | 19854 |
| 26 | 1635 | 266 | 403 | 368 | 2672 | 22526 |
| 27 | 1471 | 169 | 502 | 331 | 2473 | 24999 |
| 28 | 1670 | 223 | 452 | 430 | 2775 | 27774 |
| 29 | 1723 | 176 | 447 | 437 | 2783 | 30557 |
| 30 | 1421 | 262 | 4S4 | 401 | 2538 | 33397 |
| 31 | 1520 | 237 | 449 | 403 | 2609 | 36006 |
| Feb 1 | 1522 | 238 | 447 | 398 | 2605 | 38611 |
| 2 | 1492 | 263 | 398 | 411 | 2564 | 41175 |
| 3 | 1689 | 301 | 379 | 407 | 2776 | 43951 |
| 4 | 1734 | 266 | 420 | 397 | 2817 | 46768 |
| 5 | 1729 | 234 | 470 | 472 | 2905 | 49673 |
| 6 | 1537 | 125 | 453 | 445 | 2560 | 52233 |
| 7 | 1543 | 308 | 405 | 434 | 2690 | S4934 |
| 8 | 1547 | 275 | 379 | 475 | 2676 | 57610 |
| 9 | 1619 | 266 | 393 | 455 | 2733 | 60343 |
| 10 | 1600 | 305 | 430 | 450 | 2785 | 63128 |
| 11 | 1543 | 272 | 450 | 446 | 2711 | 65839 |
| 12 | 1616 | 247 | 299 | 459 | 2621 | 68460 |
| 13 | 1542 | 266 | 416 | 478 | 2702 | 71162 |
| 14 | 1468 | 279 | 396 | 433 | 2576 | 73738 |
| 15 | 1543 | 284 | 491 | 451 | 2769 | 76507 |
| 16 | 1382 | 271 | 309 | 416 | 2378 | 78885 |
| 17 | 1320 | 146 | 397 | 280 | 2143 | 81028 |
| 18 | 1718 | 283 | 475 | 481 | 2957 | 83985 |
| 19 | 1655 | 303 | 484 | 440 | 2882 | 86867 |
| 20 | 1399 | 164 | 417 | 405 | 2385 | 89252 |
| 21 | 1511 | 257 | 435 | 424 | 2627 | 91879 |
| 22 | 1614 | 402 | 445 | 445 | 2906 | 94785 |
| 23 | 1643 | 484 | 436 | 478 | 3041 | 97826 |
| 24 | 1648 | 436 | 442 | 536 | 3062 | 100888 |
| 25 | 1518 | 382 | 556 | 425 | 2881 | 103769 |
| 26 | 1673 | 405 | 664 | 417 | 3159 | 106928 |
| 27 | 1651 | 147 | 671 | 471 | 2940 | 109868 |
| 28 | 575 | 30 | 187 | 200 | 992 | 110860 |
| Mar 1 | 592 | 0 | 167 | 173 | 932 | 111792 |
| 2 | 515 | 17 | 215 | 217 | 964 | 112756 |
| 3 | 597 | 4 | 278 | 168 | 1047 | 113803 |
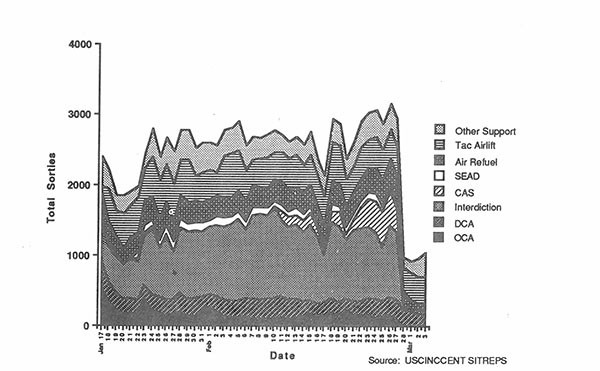
| Date | OCA | DCA | Intersiction | CAS | SEAD | Air Refuel | Tac Airlift | Other Support | Total Flown | Cum Flown |
| Jan 17 | 518 | 415 | 531 | 67 | 0 | 362 | 85 | 420 | 2388 | * |
| 18 | 362 | 272 | 487 | 72 | 0 | 298 | 460 | 269 | 2200 | * |
| 19 | 216 | 266 | 497 | 43 | 0 | 264 | 246 | 231 | 1863 | * |
| 20 | 180 | 205 | 487 | 16 | 0 | 196 | 510 | 256 | 1842 | 8323 |
| 21 | 196 | 198 | 552 | 3 | 0 | 298 | 450 | 210 | 1907 | 10230 |
| 22 | 163 | 200 | 554 | 50 | 81 | 276 | 510 | 148 | 1982 | 12212 |
| 23 | 375 | 200 | 723 | 28 | 118 | 328 | 467 | 189 | 2424 | 14636 |
| 24 | 211 | 234 | 957 | 2 | 115 | 318 | 556 | 418 | 2811 | 17447 |
| 25 | 194 | 234 | 674 | 0 | 114 | 312 | 537 | 342 | 2407 | 19854 |
| 26 | 144 | 240 | 917 | 5 | 132 | 319 | 522 | 393 | 2672 | 22526 |
| 27 | 153 | 232 | 684 | 0 | 140 | 291 | 515 | 458 | 2473 | 24999 |
| 28 | 202 | 257 | 940 | 0 | 122 | 320 | 512 | 422 | 2775 | 27774 |
| 29 | 139 | 240 | 964 | 0 | 113 | 300 | 604 | 423 | 2783 | 30557 |
| 30 | 148 | 252 | 954 | 18 | 100 | 302 | 350 | 414 | 2538 | 33397 |
| 31 | 212 | 212 | 932 | 0 | 112 | 293 | 421 | 427 | 2609 | 36006 |
| Feb 1 | 271 | 186 | 955 | 0 | 98 | 293 | 406 | 396 | 2605 | 38611 |
| 2 | 223 | 220 | 999 | 0 | 116 | 309 | 311 | 386 | 2564 | 41175 |
| 3 | 149 | 229 | 1043 | 0 | 120 | 288 | 589 | 358 | 2776 | 43951 |
| 4 | 131 | 226 | 1093 | 0 | 102 | 288 | 622 | 355 | 2817 | 46768 |
| 5 | 127 | 234 | 1161 | 0 | 115 | 289 | 559 | 420 | 2905 | 49673 |
| 6 | 141 | 247 | 1000 | 0 | 102 | 281 | 445 | 344 | 2560 | 52233 |
| 7 | 122 | 292 | 1176 | 0 | 95 | 325 | 366 | 314 | 2690 | 54934 |
| 8 | 114 | 266 | 1215 | 4 | 87 | 295 | 399 | 296 | 2676 | 57610 |
| 9 | 118 | 272 | 1201 | 0 | 92 | 287 | 434 | 329 | 2733 | 60343 |
| 10 | 122 | 272 | 1302 | 0 | 99 | 304 | 368 | 318 | 2785 | 63128 |
| 11 | 130 | 303 | 1077 | 130 | 94 | 310 | 422 | 245 | 2711 | 65839 |
| 12 | 109 | 262 | 1034 | 149 | 88 | 303 | 447 | 229 | 2621 | 68460 |
| 13 | 124 | 272 | 1056 | 132 | 100 | 297 | 454 | 260 | 2702 | 71162 |
| 14 | 140 | 222 | 994 | 160 | 79 | 314 | 387 | 280 | 2576 | 73738 |
| 15 | 184 | 199 | 1068 | 164 | 87 | 326 | 417 | 324 | 2769 | 76507 |
| 16 | 156 | 184 | 931 | 128 | 46 | 270 | 405 | 258 | 2378 | 78885 |
| 17 | 156 | 186 | 682 | 58 | 87 | 289 | 409 | 276 | 2143 | 81028 |
| 18 | 199 | 196 | 1097 | 146 | 110 | 338 | 538 | 333 | 2957 | 83867 |
| 19 | 155 | 188 | 1086 | 196 | 74 | 322 | 532 | 329 | 2882 | 86867 |
| 20 | 229 | 184 | 819 | 83 | 90 | 299 | 388 | 293 | 2385 | 89252 |
| 21 | 163 | 197 | 1024 | 138 | 87 | 309 | 366 | 343 | 2627 | 91879 |
| 22 | 160 | 202 | 1038 | 287 | 100 | 301 | 460 | 358 | 2906 | 94785 |
| 23 | 155 | 255 | 998 | 403 | 94 | 343 | 412 | 381 | 3041 | 97826 |
| 24 | 132 | 270 | 932 | 453 | 100 | 363 | 447 | 365 | 3062 | 100888 |
| 25 | 142 | 216 | 770 | 504 | 83 | 347 | 434 | 385 | 2881 | 103769 |
| 26 | 153 | 266 | 1026 | 477 | 75 | 390 | 400 | 372 | 3159 | 106928 |
| 27 | 110 | 303 | 920 | 361 | 83 | 364 | 418 | 381 | 2940 | 109868 |
| 28 | 0 | 228 | 34 | 31 | 2 | 208 | 319 | 170 | 992 | 110860 |
| Mar 1 | 0 | 216 | 44 | 8 | 0 | 108 | 392 | 164 | 932 | 111792 |
| 2 | 6 | 181 | 39 | 17 | 0 | 92 | 376 | 253 | 964 | 112756 |
| 3 | 0 | 162 | 36 | 30 | 0 | 92 | 394 | 333 | 1047 | 113803 |
[Blank]
D-4
Statistics of Carrier Fixed-wing Flight Operations During Desert Storm
During Operation Desert Storm (from 17 January to 28 February), the six U.S. aircraft carriers deployed to the theater flew a total of 18,117 fixed-wing aircraft sorties. Of these sorties, 16,899 were combat or direct combat-support missions. The remaining 1,218 sorties included logistics flights, functional check flights for newly arrived or repaired aircraft, or other indirect support activities.
Table 1 shows the combat and combat-support sorties flown by all the carriers according to an analysis of carrier launch and recovery logs, air plans, and steam catapult logs. The number of sorties is broken out into the eight mission categories reported in the daily Central Command situation reports. These mission categories include offensive counterair (OCA), defensive counterair (DCA), interdiction, close air support (CAS), suppression of enemy air defenses (SEAD), aerial refueling, tactical airlift, and other support, including electronic support measures (ESM), electronic countermeasures (ECM), airborne early warning (AEW) and other support activities. Figure 1 shows the daily distribution of Navy sorties by mission area. Figure 2 depicts the same data in terms of the percentage of the total sorties flown in a given mission category each day.
Because the breakdown given in table 1 does not include all Navy fixed-wing sorties, and because the definition of mission categories imperfectly reflects Navy operations, table 2 employs a different set of mission categories to obtain another view of carrier activity. This set of missions includes OCA and DCA missions as defined in table 1. The theater strike mission includes interdiction, CAS, and sorties that were capable of both SEAD and strike. Maritime strike missions include armed surface combat air patrol (SUCAP) and armed reconnaissance missions (which attacked not only ships at sea but some coastal targets as well). The SEAD/EW mission includes not only SEAD missions (those armed with HARM or other air-to-surface weapons targeted against surface air defenses) but both ESM and ECM missions as well. Combat support is equivalent to the category other support in table 1. The general support category in table 2 includes logistics and other missions. A small number of sorties could not be categorized based on the information available at the time of publication. These sorties are listed as unknown. Figures 3 and 4 show the sortie breakdown in terms of numbers and percentages in a manner similar to figures 1 and 2.
D-5
Table 1. CV fixed-wing combat and combat support sorties
| 17-Jan | 18-Jan | 19-Jan | 20-Jan | 21-Jan | 22-Jan | 23-Jan | 24-Jan | 25-Jan | 26-Jan | 27-Jan | 28-Jan | 29-Jan | 30-Jan | 31-Jan | |
| OCA | 68 | 39 | 79 | 50 | 26 | 45 | 36 | 46 | 42 | 30 | 45 | 75 | 10 | 13 | 18 |
| DCA | 122 | 144 | 54 | 106 | 93 | 77 | 94 | 105 | 103 | 70 | 97 | 99 | 94 | 86 | 99 |
| Interdiction | 91 | 75 | 74 | 78 | 79 | 75 | 82 | 119 | 91 | 70 | 89 | 96 | 106 | 144 | 139 |
| CAS | 0 | 0 | 0 | 0 | 0 | 0 | 0 | 0 | 0 | 0 | 0 | 0 | 5 | 13 | |
| SEAD | 78 | 18 | 12 | 4 | 13 | 16 | 10 | 9 | 22 | 8 | 7 | 22 | 4 | 5 | 10 |
| Aerial refuel | 85 | 101 | 71 | 71 | 64 | 72 | 67 | 81 | 81 | 74 | 88 | 98 | 74 | 77 | 83 |
| Tac airlift | 0 | 0 | 0 | 0 | 0 | 0 | 0 | 0 | 0 | 0 | 0 | 0 | 0 | 0 | 0 |
| Other support | 104 | 58 | 51 | 54 | 52 | 68 | 57 | 74 | 56 | 54 | 56 | 62 | 43 | 52 | 60 |
| Total | 548 | 435 | 341 | 363 | 327 | 354 | 346 | 434 | 395 | 306 | 382 | 452 | 331 | 382 | 422 |
| 1-Feb | 2-Feb | 3-Feb | 4-Feb | 5-Feb | 6-Feb | 7-Feb | 8-Feb | 9-Feb | 10-Feb | 11-Feb | 12-Feb | 13-Feb | 14-Feb | 15-Feb | |
| OCA | 19 | 17 | 28 | 12 | 34 | 22 | 31 | 23 | 29 | 29 | 44 | 32 | 35 | 19 | 25 |
| DCA | 98 | 72 | 80 | 102 | 95 | 65 | 71 | 74 | 73 | 73 | 74 | 59 | 60 | 73 | 74 |
| Interdiction | 168 | 102 | 110 | 141 | 187 | 106 | 131 | 124 | 130 | 145 | 164 | 112 | 143 | 141 | 159 |
| CAS | 2 | 0 | 0 | 0 | 0 | 0 | 0 | 0 | 0 | 0 | 0 | 0 | 0 | 0 | 0 |
| SEAD | 1 | 0 | 3 | 4 | 6 | 14 | 7 | 8 | 6 | 8 | 8 | 5 | 17 | 10 | 4 |
| Aerial Refuel | 83 | 66 | 52 | 57 | 51 | 49 | 60 | 62 | 66 | 61 | 69 | 48 | 47 | 53 | 65 |
| Tac Airlift | 0 | 0 | 0 | 0 | 0 | 0 | 0 | 0 | 0 | 0 | 0 | 0 | 0 | 0 | 0 |
| Other support | 67 | 54 | 52 | 60 | 56 | 57 | 66 | 62 | 53 | 58 | 68 | 78 | 57 | 59 | 68 |
| Total | 438 | 311 | 325 | 376 | 429 | 313 | 366 | 353 | 357 | 374 | 427 | 334 | 359 | 355 | 395 |
| 16-Feb | 17-Feb | 18-Feb | 19-Feb | 20-Feb | 21-Feb | 22-Feb | 23-Feb | 24-Feb | 25-Feb | 26-Feb | 27-Feb | 28-Feb | |
| OCA | 39 | 17 | 41 | 29 | 22 | 28 | 22 | 34 | 60 | 40 | 49 | 36 | 6 |
| DCA | 52 | 86 | 84 | 85 | 91 | 91 | 90 | 36 | 72 | 75 | 80 | 100 | 86 |
| Interdiction | 105 | 117 | 193 | 206 | 180 | 197 | 152 | 198 | 196 | 261 | 311 | 293 | 98 |
| CAS SEAD | 0 5 | 0 9 | 0 7 | 0 8 | 0 4 | 0 0 | 0 12 | 0 0 | 0 0 | 0 12 | 0 6 | O• 8 | O O |
| Aerial Refuel | 34 | 50 | 56 | 56 | 43 | 53 | 52 | 50 | 59 | 75 | 74 | 66 | 38 |
| Tuc AWift | 0 | 0 | 0 | 0 | 0 | 0 | 0 | O | O | O | O | O | O |
| Other support | 46 | 48 | 75 | 76 | 61 | 72 | 65 | 66 | 58 | 61 | 78 | 74 | 54 |
| Total | 281 | 327 | 456 | 460 | 401 | 441 | 393 | 384 | 445 | 524 | 598 | 577 | 282 |
D-6
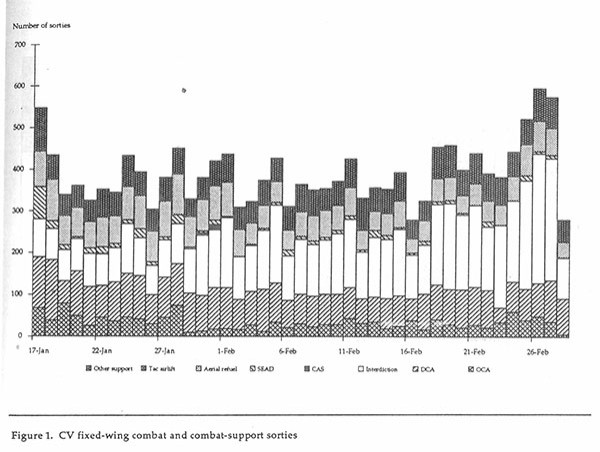
Figure 1. CV fixed-wing combat and combat-support sorties
D-7
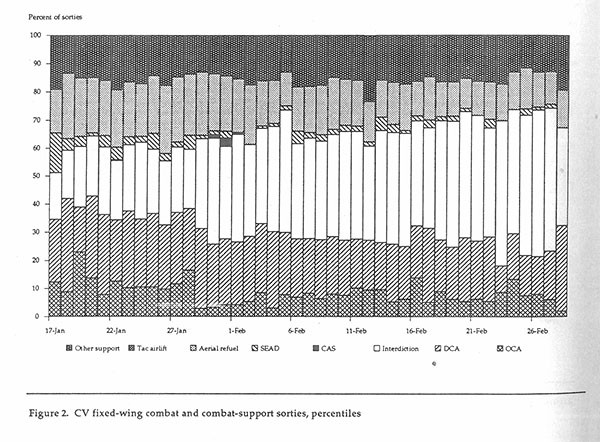
Figure 2. CV fixed-wing combat and combat-support sorties, percentiles
D-8
Table 2. Total CV fixed-wing sorties
| 17-Jan | 18-Jan | 19-Jan | 20-Jan | 21-Jan | 22-Jan | 23-Jan | 24-Jan | 25-Jan | 26-Jan | 27-Jan | 28-Jan | 29-Jan | 30-Jan | 31-Jan | |
| OCA | 68 | 39 | 79 | 50 | 26 | 45 | 36 | 46 | 42 | 30 | 45 | 75 | IO | I3 | I8 |
| DCA | I22 | I44 | 54 | I06 | 93 | 77 | 94 | IOS | I03 | 70 | 97 | 99 | 94 | 86 | 99 |
| Theater strike | 69 | 67 | 6I | 49 | 4I | 54 | 49 | 82 | 56 | 4I | 48 | 63 | 65 | 117 | 116 |
| Maritime strike | 22 | I2 | 20 | 32 | 38 | 22 | 33 | 37 | 35 | 29 | 4I | 33 | 4I | 32 | 36 |
| SEAD/EW | 113 | 37 | 3I | 26 | 35 | 4I | 28 | 34 | 35 | 24 | 22 | 4I | 20 | 23 | 3I |
| Tanking | 85 | IOI | 71 | 71 | 64 | 72 | 67 | 8I | 8I | 74 | 88 | 98 | 74 | 77 | 83 |
| Combat support | 69 | 39 | 32 | 32 | 30 | 43 | 39 | 49 | 43 | 38 | 4I | 43 | Tl | 34 | 39 |
| General support | 73 | 64 | 11 | IO | 5 | I4 | 6 | I3 | I2 | 5 | 6 | I8 | 34 | 26 | 11 |
| Unknown | 8 | 7 | 2 | 7 | 5 | 4 | 4 | 6 | 35 | I4 | I4 | IO | 6 | I5 | 9 |
| Total | 629 | 506 | 354 | 380 | 337 | 372 | 356 | 453 | 442 | 325 | 402 | 480 | 371 | 423 | 442 |
| 1-Feb | 2-Feb | 3-Feb | 4-Feb | 5-Feb | 6-Feb | 7-Feb | 8-Feb | 9-Feb | 10-Feb | 11-Feb | 12-Feb | 13-Feb | 14-Feb | 15-Feb | |
| OCA | I9 | I7 | 28 | I2 | 34 | 22 | 3I | 23 | 29 | 29 | 44 | 32 | 35 | I9 | 25 |
| DCA | 98 | 72 | 80 | I02 | 95 | 65 | 71 | 74 | 73 | 73 | 74 | 59 | 60 | 73 | 74 |
| Theater strike | I36 | 65 | 8I | 115 | I59 | 82 | 104 | 91 | 102 | 127 | I45 | 95 | 123 | 126 | 143 |
| Maritime strike | 34 | 37 | 3I | 26 | 28 | 24 | Z1 | 33 | 28 | I8 | I9 | I7 | 20 | I5 | 16 |
| SEAD/EW | 26 | I7 | 22 | 26 | 30 | 39 | 40 | 32 | 30 | 34 | 36 | 28 | 45 | 37 | 40 |
| Tanking | 83 | 66 | 52 | 57 | 5I | 49 | 60 | 62 | 66 | 6I | 69 | 48 | 47 | 65 | |
| Combat support | 42 | 37 | 33 | 38 | 32 | 32 | 33 | 38 | 29 | 32 | 40 | 55 | 29 | 32 | 32 |
| General support | 26 | I2 | I8 | I2 | 17 | 11 | 11 | 18 | 15 | 7 | 58 | 56 | 18 | 15 | 32 |
| Unknown | IO | 6 | I3 | 3 | 12 | 6 | 9 | 2 | 2 | 3 | 9 | 5 | 9 | 8 | 15 |
| Total | 474 | 329 | 356 | 39I | 458 | 330 | 373 | 374 | 384 | 494 | 395 | 386 | 378 | 442 | |
| 16-Feb | 17-Feb | 18-Feb | 19-Feb | 20-Feb | 21-Feb | 22-Feb | 23-Feb | 24-Feb | 25-Feb | 26-Feb | 27-Feb | 28-Feb | |||
| OCA | 39 | I7 | 0 | 29 | 22 | w | 22 | 34 | 60 | 40 | w | 6 | |||
| DCA | 52 | 86 | M | 85 | 36 | 72 | 80 | 86 | |||||||
| Theater strike | 85 | 87 | I63 | 18I | 154 | 172 | 126 | I76 | I71 | 244 | 279 | 27I | 74 | ||
| Maritime strike | 20 | 30 | 30 | 25 | 26 | 25 | 26 | 22 | 25 | 17 | 32 | 23 | 26 | ||
| SEAD/EW | 26 | 25 | 45 | 44 | 32 | 28 | 4I | 34 | 26 | 34 | 37 | 38 | 21 | ||
| Tanking | 34 | 50 | 56 | 56 | 43 | g | 50 | 59 | n | 38 | |||||
| Combat support | 25 | 32 | 37 | 40 | 33 | 44 | 36 | 32 | 32 | 39 | 47 | 44 | 33 | ||
| General support | IO | 25 | 14 | 8 | IO | 15 | 29 | 19 | 14 | 22 | 22 | 16 | 26 | ||
| Unknown | 6 | 2 | 12 | 3 | 2 | 9 | I2 | 10 | 5 | 11 | 8 | I3 | 3 | ||
| Total | 297 | 354 | 482 | 471 | 413 | 465 | 434 | 413 | 452 | 569 | 628 | 606 | 311 | ||
D-9
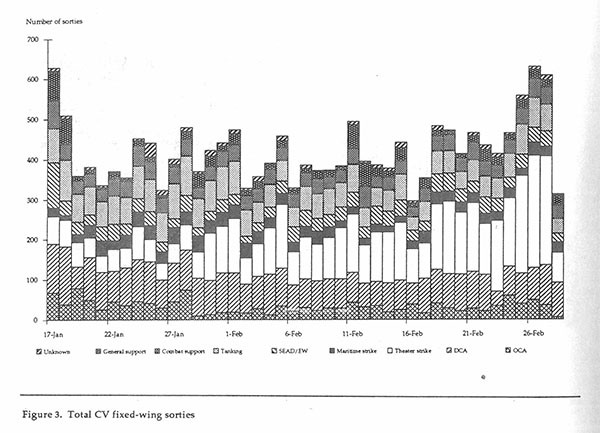
Figure 3. Total CV fixed-wing sorties
D-10
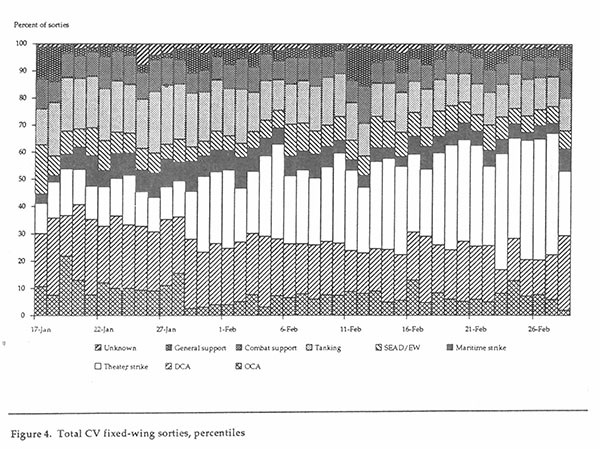
Figure 4. Total CV fixed-wing sorties, percentiles
D-11
[Blank]
D-12
[END]


